📚 Composite Soundings
Composite soundings place multiple vertical profiles on the same thermodynamic diagram. They are useful for:
comparing environmental evolution through time;
comparing observations with model/reanalysis data;
comparing forecast hours;
comparing multiple nearby locations;
comparing experimental or custom profiles.
SounderPy creates these figures with build_composite().
Retrieve Several Profiles
This example compares three OAX soundings surrounding the 16 June 2014 severe weather event:
import sounderpy as spy

data_12z = spy.get_obs_data(
    "OAX", "2014", "06", "16", "12",
    hush=True,
)

data_18z = spy.get_obs_data(
    "OAX", "2014", "06", "16", "18",
    hush=True,
)

data_00z = spy.get_obs_data(
    "OAX", "2014", "06", "17", "00",
    hush=True,
)
Put the profiles into a list:
profiles = [
    data_12z,
    data_18z,
    data_00z,
]
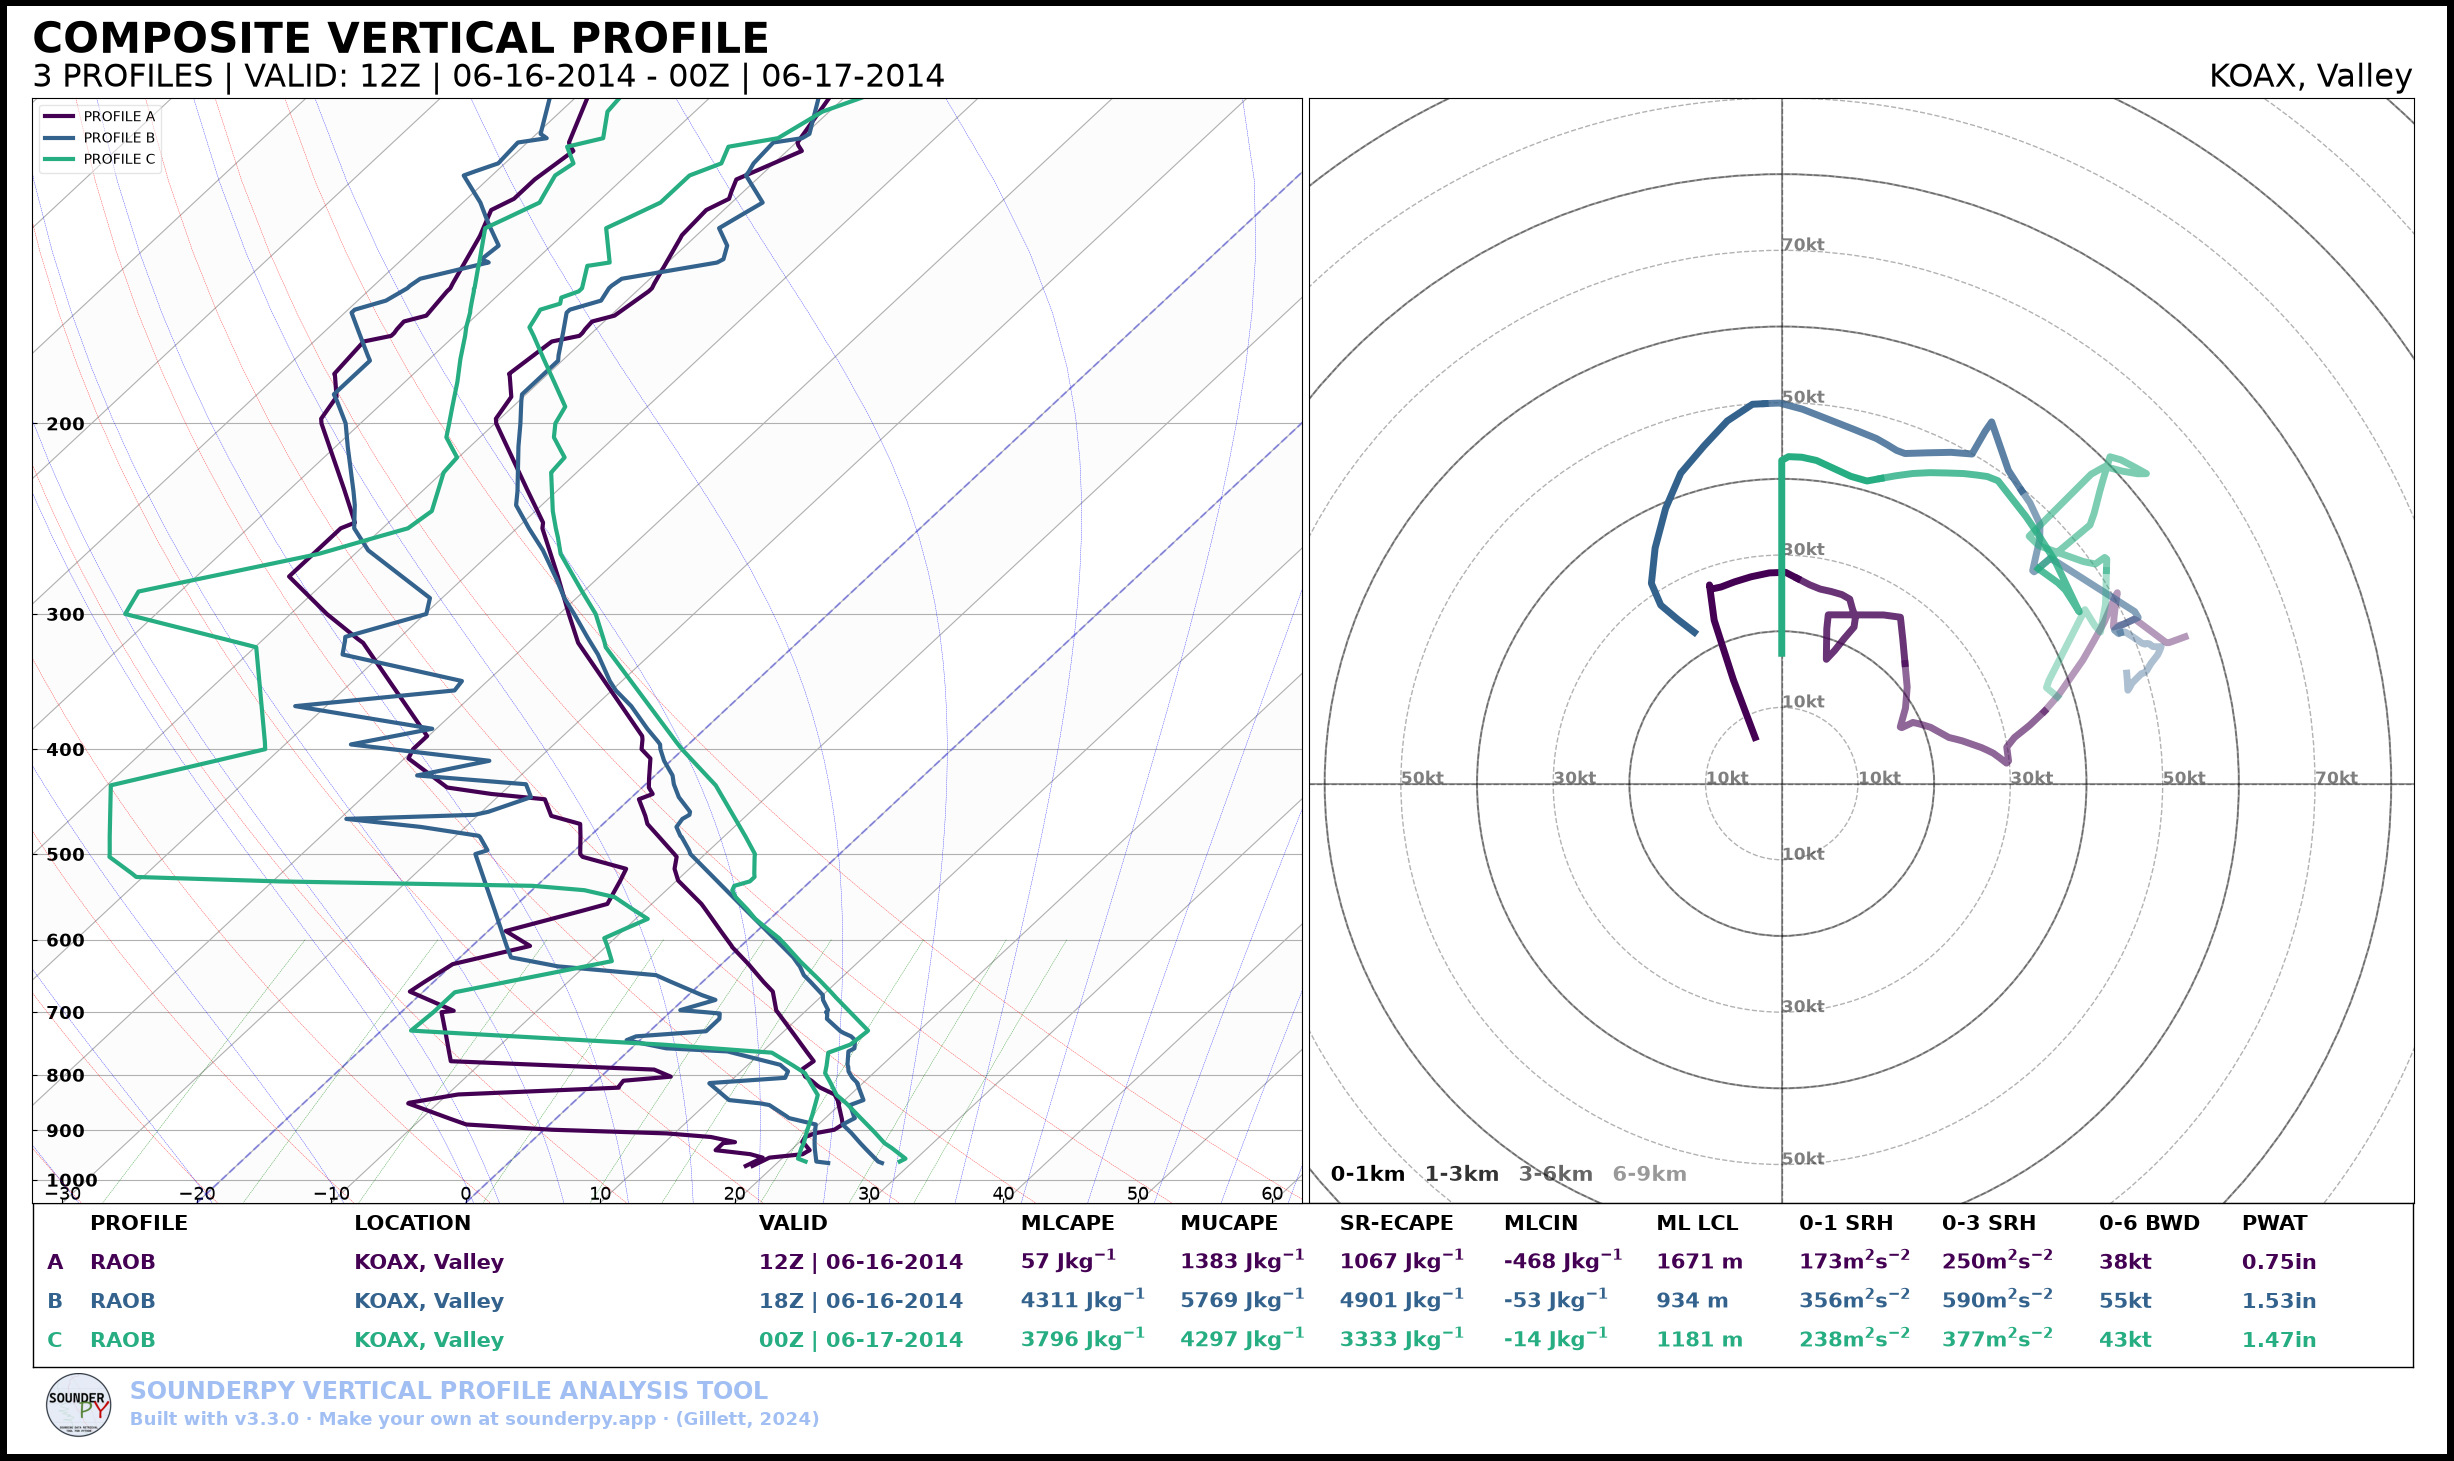
Basic Composite
Create the comparison with:
spy.build_composite(
    profiles,
    shade_between=False,
)
Dark-Mode Composite
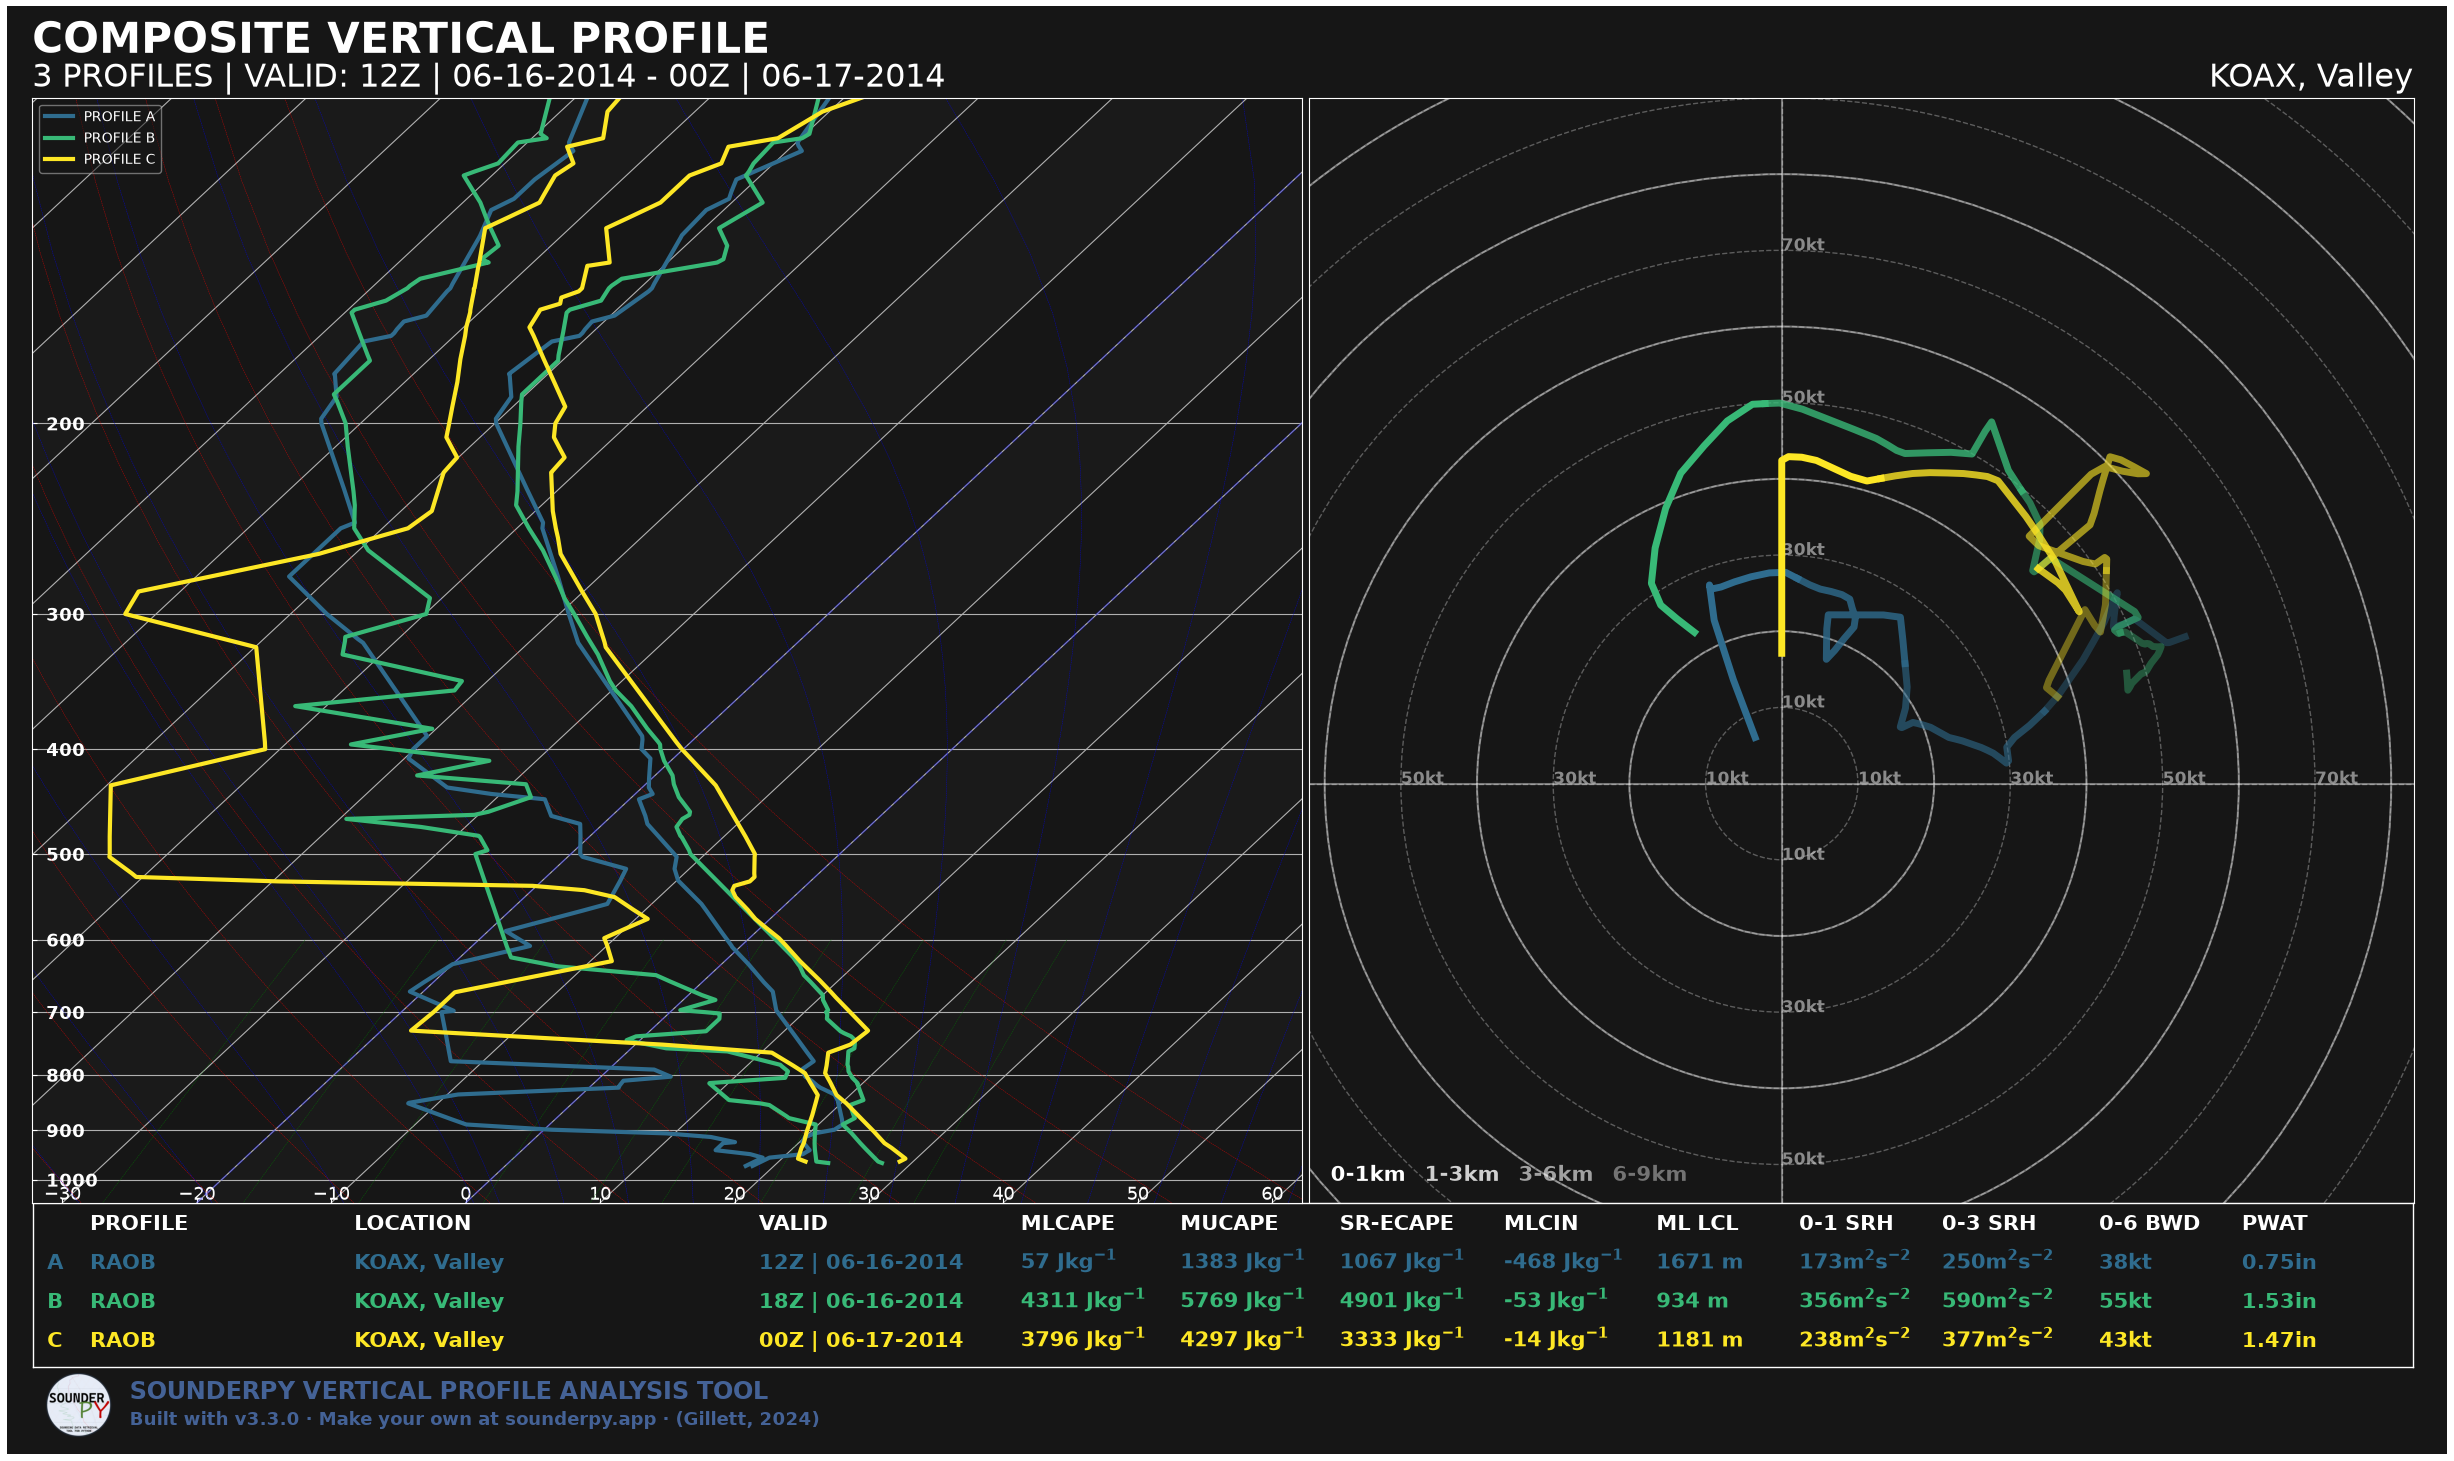
spy.build_composite(
    profiles,
    shade_between=False,
    dark_mode=True,
)
Skew-T or Hodograph Only
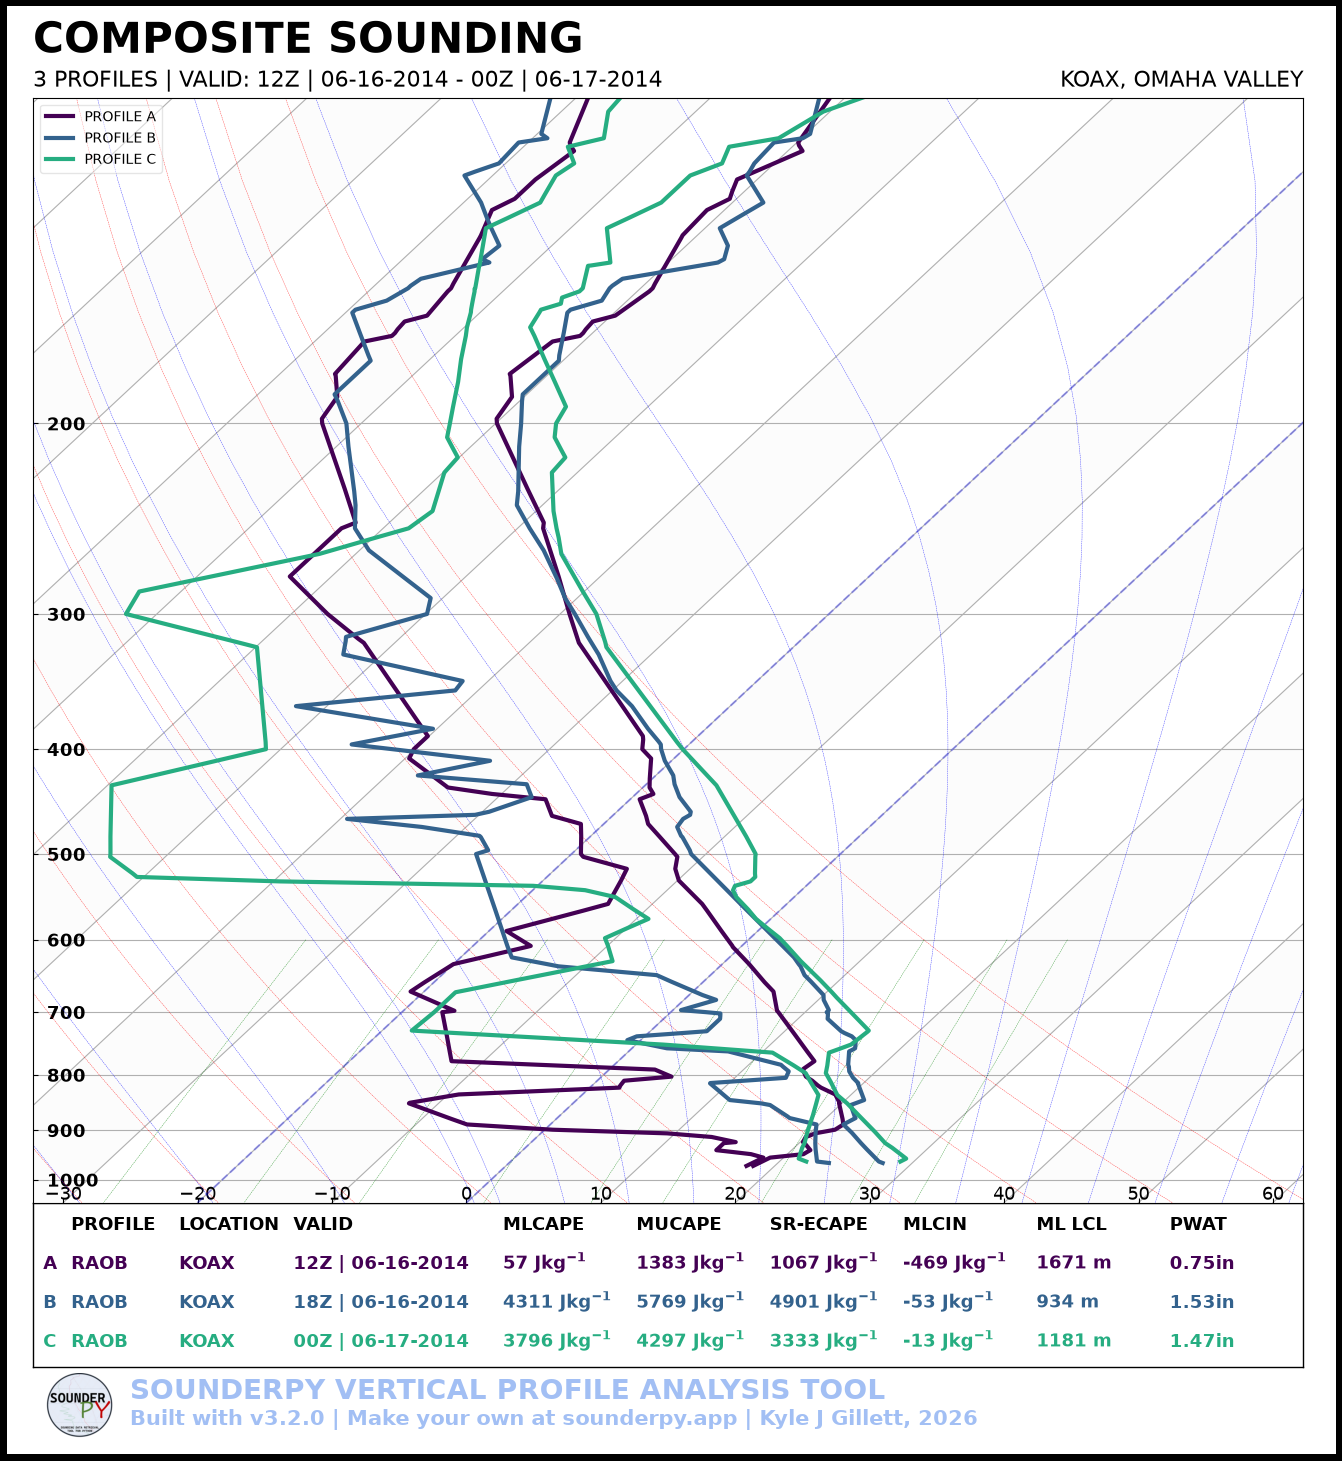
style sets which panels the figure shows. The default, "full", shows
both the skew-T and the hodograph. "sounding" shows only the skew-T, and
"hodograph" shows only the hodograph:
spy.build_composite(
    profiles,
    shade_between=False,
    style="sounding",
)
spy.build_composite(
    profiles,
    style="hodograph",
)
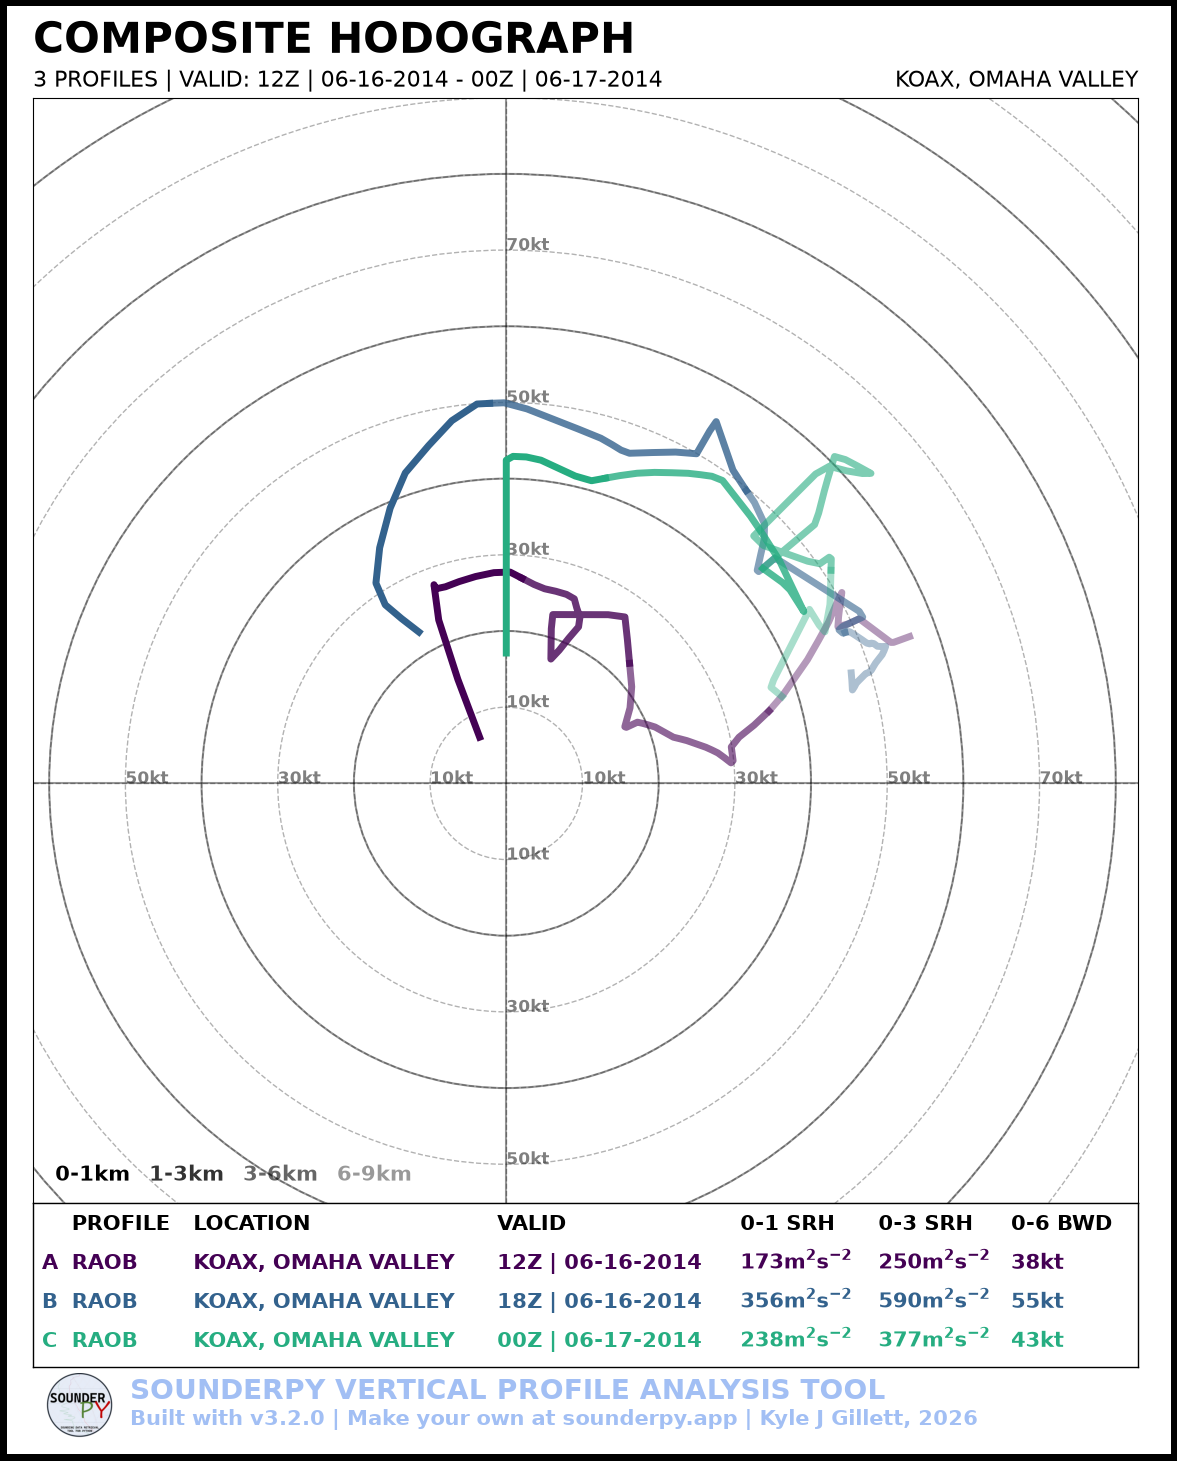
Each style’s table lists the parameters that go with its panel: thermodynamic
values with "sounding" and kinematic values with "hodograph". To fit
them, the "sounding" table lists each profile’s site ID as its location.
ylim only applies to the skew-T, so style="hodograph" ignores it.
sr_hodo=True draws the hodograph storm relative with the "full" and
"hodograph" styles. Each profile’s winds are shifted by its own storm
motion, set by storm_motion:
spy.build_composite(
    profiles,
    style="hodograph",
    sr_hodo=True,
)
If any profile has no storm motion, SounderPy warns and draws the hodograph ground relative instead.
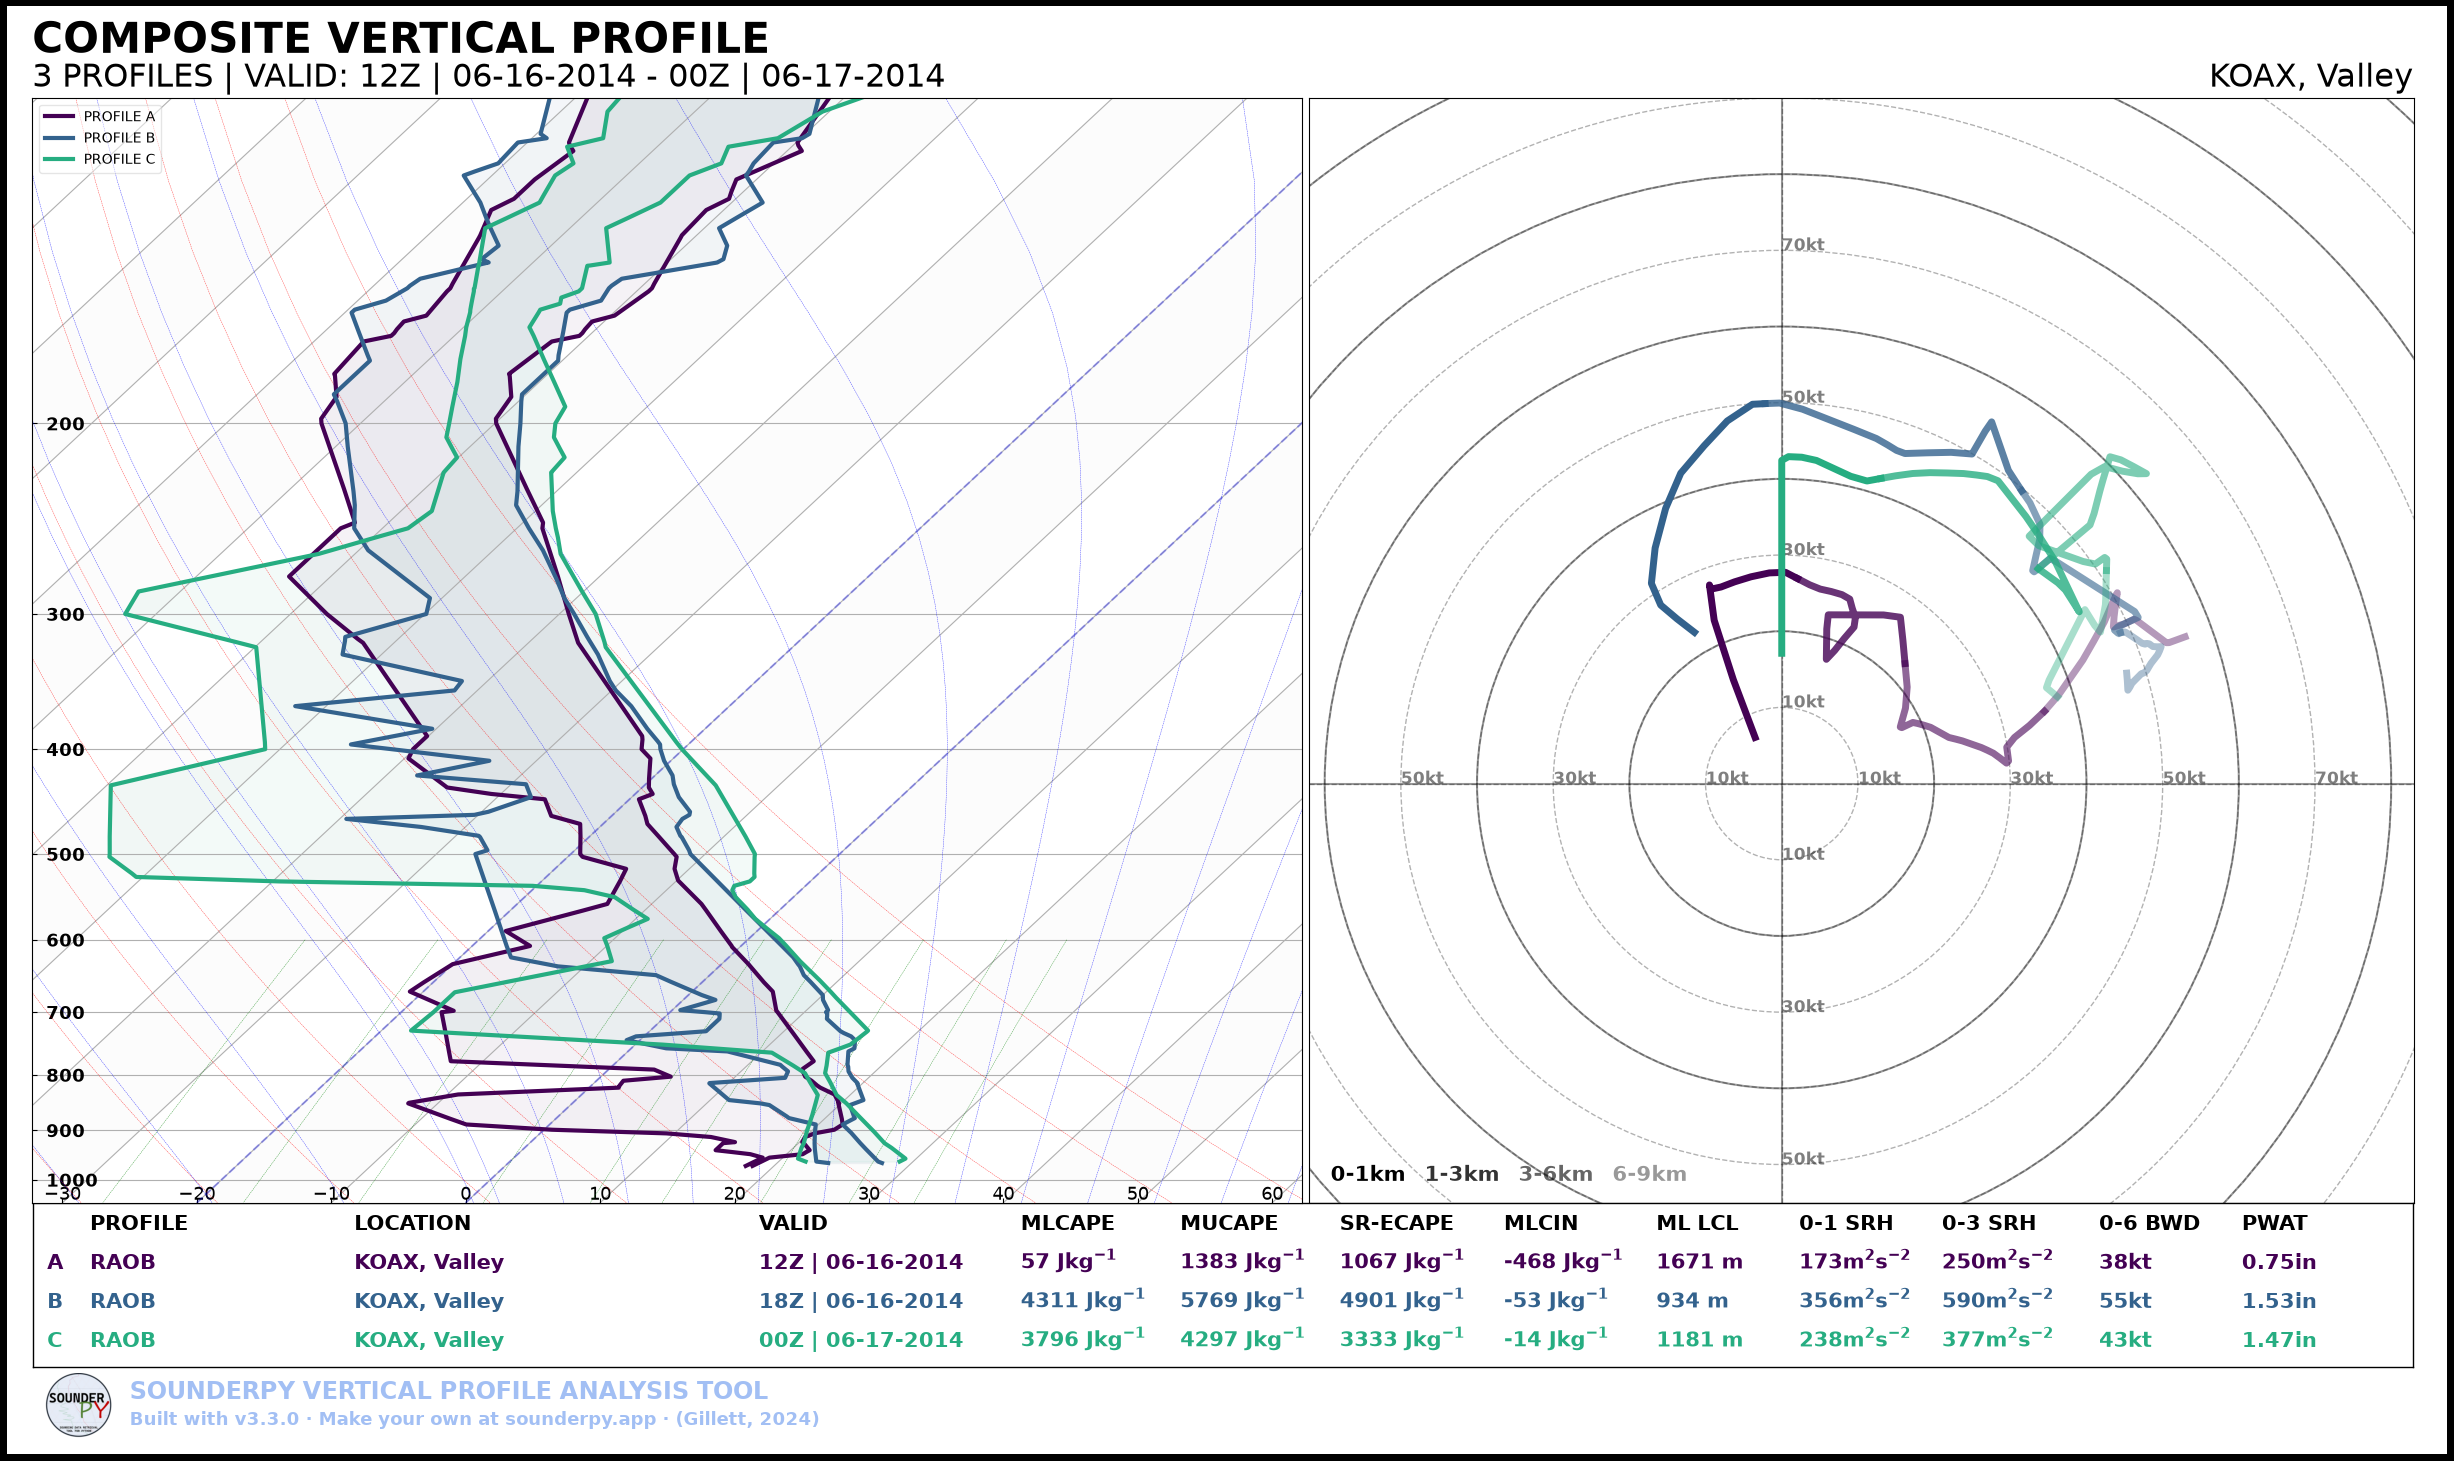
Shading between Temperature and Dewpoint
shade_between=True lightly shades the region between each profile’s
temperature and dewpoint traces:
spy.build_composite(
    profiles,
    shade_between=True,
)
Choosing a Colormap
By default, SounderPy samples colors from viridis. Any compatible
Matplotlib colormap can be supplied:
spy.build_composite(
    profiles,
    cmap="plasma",
)
or:
spy.build_composite(
    profiles,
    cmap="coolwarm",
)
Custom Colors
Provide one color for each profile with colors:
spy.build_composite(
    profiles,
    colors=[
        "tab:blue",
        "tab:orange",
        "tab:red",
    ],
)
If custom colors are supplied, the list length should match the number of profiles.
Line Styles
Line styles can also be assigned profile-by-profile:
spy.build_composite(
    profiles,
    linestyles=[
        "--",
        "-",
        ":",
    ],
)
Line Widths
spy.build_composite(
    profiles,
    linewidths=[
        2,
        4,
        2,
    ],
)
Opacity
spy.build_composite(
    profiles,
    alphas=[
        0.6,
        1.0,
        0.6,
    ],
)
Combine Styling Options
For example, emphasize the middle profile:
spy.build_composite(
    profiles,
    colors=[
        "tab:blue",
        "tab:red",
        "tab:purple",
    ],
    linestyles=[
        "--",
        "-",
        "--",
    ],
    linewidths=[
        2,
        4,
        2,
    ],
    alphas=[
        0.6,
        1.0,
        0.6,
    ],
    shade_between=False,
)
Compare Different Data Sources
Composite inputs do not have to come from the same source.
For example:
profiles = [
    observed_data,
    rap_data,
    bufkit_data,
]

spy.build_composite(
    profiles,
    colors=[
        "black",
        "tab:blue",
        "tab:orange",
    ],
)
Because each source has already been converted into clean_data,
build_composite() can treat them consistently.
Faster Composites
Each profile’s parameters are calculated for the table under the figure. Turn
the table off with show_params=False to make a composite more quickly:
spy.build_composite(
    profiles,
    show_params=False,
)
When the table is shown, storm_motion sets the storm motion used for every
profile’s parameters:
spy.build_composite(
    profiles,
    storm_motion="left_moving",
)
ylim zooms the skew-T into one pressure range, as with
build_sounding():
spy.build_composite(
    profiles,
    ylim=(1000, 700),
)
Save the Figure
spy.build_composite(
    profiles,
    shade_between=False,
    save=True,
    filename="oax_composite.png",
)
Next Steps
Continue to Exporting Data to save retrieved profiles for other software and workflows.
See also: